Solutions
One platform for every ESG obligation
Measure, score and report your organisation’s sustainability performance, from BRSR to buyer questionnaires, on one connected platform.
How the platform connects
Enter data once. Use it everywhere.
Every module reads from the same NIS data layer. Carbon numbers feed your Impact Score, social outcomes feed your story, and all of it flows into framework-ready reports.
- Connect: cloud, on-prem and API sources
- Measure: carbon and social metrics, scored
- Report: BRSR, GRI, SASB, UNGC, ISO
- Improve: strategy mapped to the SDGs, then repeat

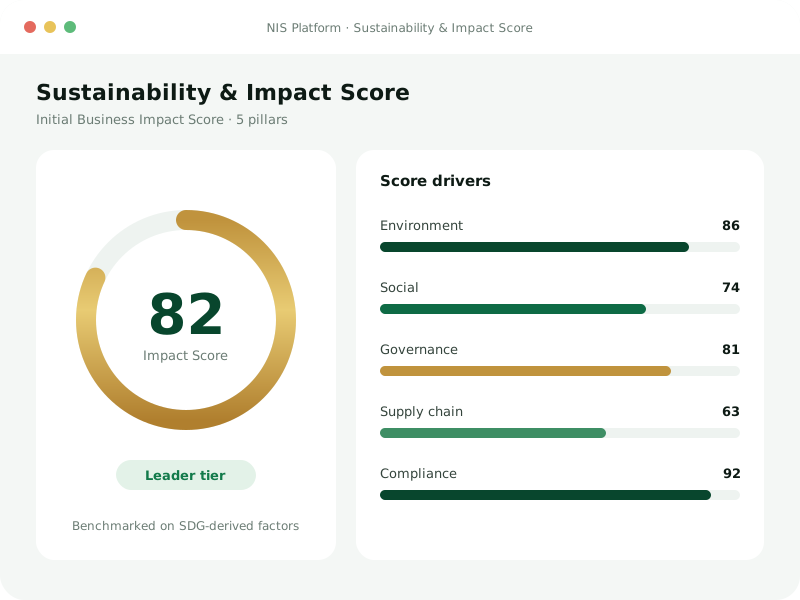
01 · Sustainability & Impact Score
Know exactly where you stand
The problem: Most teams cannot say how sustainable their operations really are, or which gaps matter most. Without a baseline, every target is a guess.

Secure data collection across sites and teams

A Business Impact Score built on SDG-derived factors

MEL dashboards to track progress over time
02 · Carbon Module
Carbon accounting, powered by AI
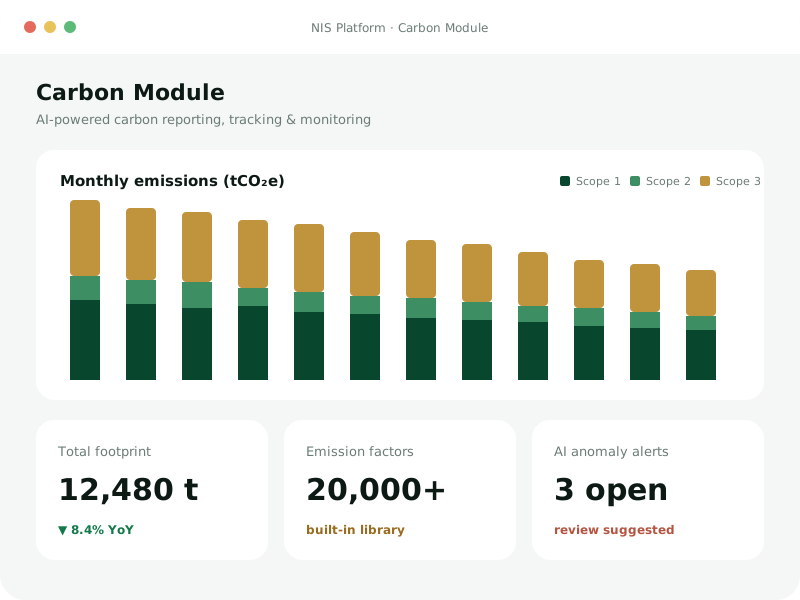
The problem: Scope 1, 2 and 3 numbers are rebuilt by hand every year, and CBAM and CCTS now need them to be defensible, not approximate.

Real-time and batch emissions data capture

20,000+ built-in emission factors

Automated, visual carbon reports and alerts
Best for Listed companies & MSMEs

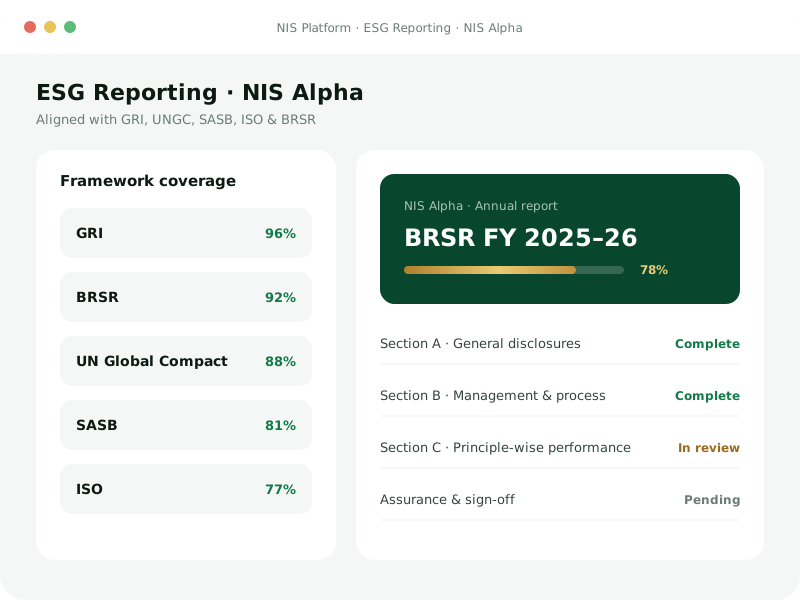
04 · ESG Reporting · NIS Alpha
Framework-ready reports, without the grind
The problem: BRSR, GRI and buyer questionnaires ask for the same data in different shapes. Rebuilding each one wastes weeks.

Tailor-made reports for the metrics that matter

Aligned with GRI, UNGC, SASB, ISO and BRSR

Secure data management with an audit trail

SDG alignment
Everything you measure, mapped to the global goals
The Sustainable Development Goals are 17 goals adopted by the United Nations in 2015 as part of the 2030 Agenda for Sustainable Development.
- Investors increasingly ask which goals your work contributes to.
- Reporting requirements are easier to meet when every metric has a clear link to a goal.
- Credibility comes from showing measured contribution, not claims.
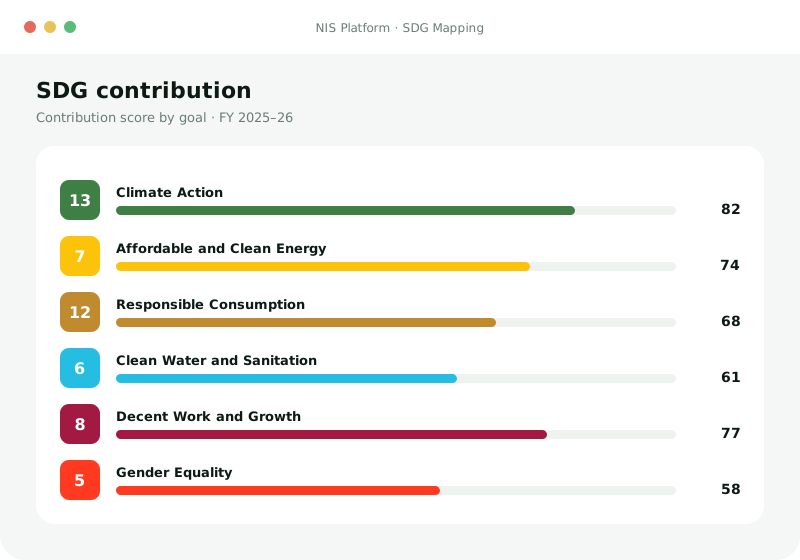
- Collect dataOperational, workforce and emissions data flows in from your systems.
- Map to SDG targetsEach indicator is linked to the SDG targets it relates to.
- Score each goalNIS scores your contribution goal by goal.
- Report and trackProgress is tracked over time and shared in your reports.
Scope 1, 2 and 3 emissions from the Carbon Module.
Highlighted goals are the ones NIS measures most directly. Hover or tap a goal.Which module covers which goals
SDG mapping sits alongside the frameworks you already report under: GRI, BRSR, SASB, UN Global Compact and ISO.
By audience
What NIS does for you
Listed companies & MSMEs
The pain
BRSR is due with the annual report, Core indicators now need assessment or assurance, and export buyers keep sending new ESG and CBAM questionnaires.
What you get
- One data layer for BRSR, assurance evidence and buyer requests
- Scope 1, 2 and 3 carbon numbers you can defend
- Framework-ready reports in days, not months
Relevant modules ESG Reporting Carbon Module Impact Score
Not sure where to start?
Tell our founder what is on your desk. You will get a straight answer on whether NIS fits.
 Vasudha SaraogiFounder & CEO
Investors & lenders
The pain
LPs and regulators want portfolio-level ESG data, but every investee reports differently, late, or not at all.
What you get
- Comparable impact scores across investees
- Portfolio-wide ESG and MEL dashboards
- Evidence for impact reports and fund disclosures
Relevant modules Impact Score ESG Reporting
Not sure where to start?
Tell our founder what is on your desk. You will get a straight answer on whether NIS fits.
Vasudha SaraogiFounder & CEOInstitutions & programmes
The pain
Programmes create change on the ground, but funders and boards need structured monitoring, evaluation and proof of outcomes.
What you get
- MEL frameworks with live progress tracking
- SDG-mapped dashboards for every programme
- Visual impact stories stakeholders understand
Relevant modules Social Impact Impact Score
Not sure where to start?
Tell our founder what is on your desk. You will get a straight answer on whether NIS fits.
Vasudha SaraogiFounder & CEOHow onboarding works
Live in weeks, not quarters
Our team does the heavy lifting. Typical timeline for a first reporting cycle:
Week 1
Kick-off & data map
We map your BRSR scope, sites and data owners, and agree what “done” looks like.
Weeks 2–3
Connect your data
Integrations and templates bring in energy, HR, supplier and plant data. No rebuild of your systems.
Week 4
Baseline & score
Your first emissions baseline and Business Impact Score, with gaps flagged.
Week 6
First report out
A framework-ready draft for BRSR or your buyer, with the evidence behind each number.
Integrations
Works with the tools you already use
10+ integrations out of the box, in batch or real time, so your team does not re-key a single number.
Amazon Web Services
Cloud
Microsoft Azure
Cloud
Google Cloud
Cloud
On-prem VMs
On-prem

SFTP
File transfer
REST API
API
Excel & CSV uploads
Batch
Real-time streams
Streaming
FAQ
Questions, answered
Everything you need to know about NIS. Can’t find what you’re looking for? Our team is happy to help.
What is NIS?
NIS (NorthStar Impact Solutions) is an intelligent SaaS platform that helps organisations measure, analyse and score their sustainability goals and climate commitments. It brings ESG data collection, carbon accounting, impact scoring and reporting into one place.
Which reporting frameworks does NIS support?
NIS Alpha aligns your reporting with globally recognised frameworks including GRI, the UN Global Compact, SASB, ISO and BRSR, and maps initiatives to the UN Sustainable Development Goals.
Can NIS connect to our existing systems?
Yes. NIS offers 10+ integrations across multi-cloud (AWS, Azure, GCP), on-prem sources (VMs, SFTP) and APIs, with both batch and real-time data acquisition, so you don’t have to rebuild your data stack.
How is the Business Impact Score calculated?
The score is based on sustainable development factors derived from globally acclaimed frameworks. It evaluates your operations across areas such as environment, social inclusion, governance, supply chain and compliance, and the parameters behind it show exactly where to improve.
Who is NIS built for?
Businesses that want to go beyond compliance, investors who need portfolio-wide ESG visibility, and institutions that run programmes needing Monitoring, Evaluation & Learning (MEL) and SDG dashboards.
Do we need to use every module?
No. You can start with the module that solves your most urgent need, such as the Carbon Module or ESG Reporting, and add the Impact Score or Social Impact Visualisation as you grow.
Does NIS help with BRSR Core assurance?
Yes. NIS keeps the evidence behind every BRSR Core indicator (source, owner, calculation) in one place, so your assessment or assurance provider can trace each number without chasing spreadsheets.
How do we get started?
Book a free BRSR Readiness Review. We’ll understand your goals, show the platform with examples relevant to your industry and suggest the right starting point.
Your next filing, without the scramble.
Book a free BRSR Readiness Review. In 30 minutes we map where your data stands, what assurance will ask for, and what to fix first.
Or talk to the founder directly
Vasudha SaraogiFounder & CEO
03 · Social Impact Visualisation
Make intangible impact visible
The problem: CSR and community programmes create real change, but it rarely shows up in reports. Stakeholders want evidence, not anecdotes.
Embedded, shareable data visualisation
Interactive, multi-dimensional exploration
Storytelling that shapes your impact narrative
Best for Institutions & programmes Listed companies & MSMEs